When working with an external closed-source library, it is sometimes useful to understand how it works and debug it as if it were part of your solution.
To display source code when debugging, Visual Studio relies on PDB files (symbol files) to link compiled code to source code. It needs both the PDB file and the .cs files, which it can load from local disk or a symbol server. With closed-source assemblies, neither is available, so you cannot step into the DLL's code.
Starting with Visual Studio 2019 16.5, you can generate a PDB and source files by decompiling the assembly. Visual Studio uses ILSpy for decompilation. Keep in mind that decompilation has limitations: original comments and variable names are lost, some patterns may not be recognized correctly, and obfuscated DLLs can be especially difficult to read.
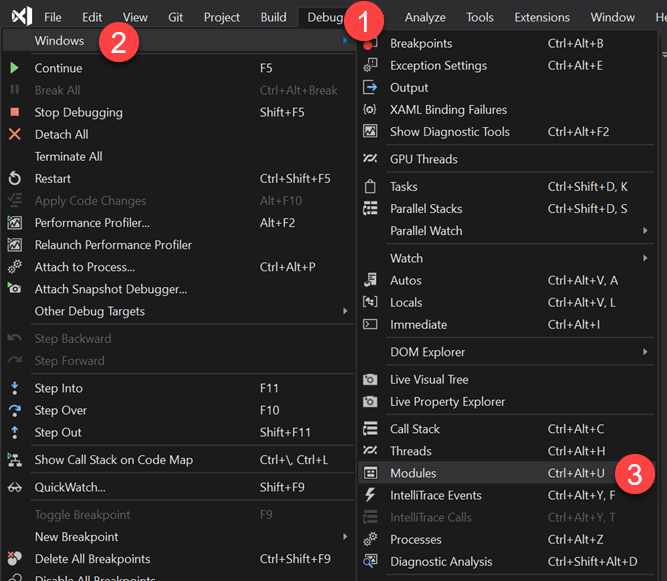
Open the modules window from the menu Debug -> Windows -> Modules
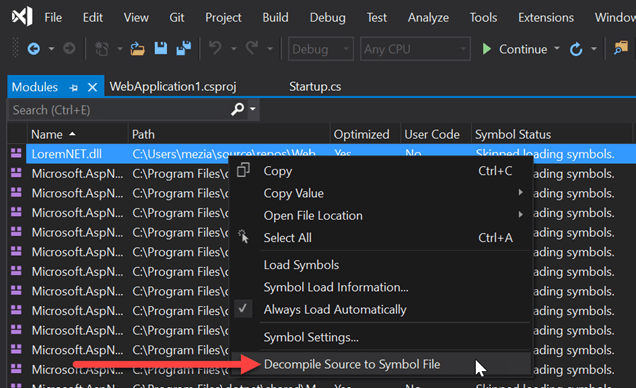
Find the module to decompile, right-click on it, and select "Decompile Source to Symbol File"
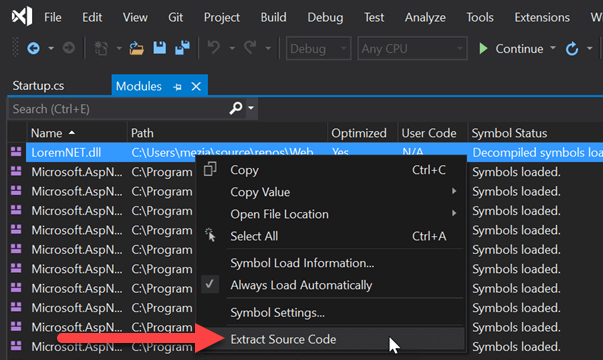
You should now be able to step into the code
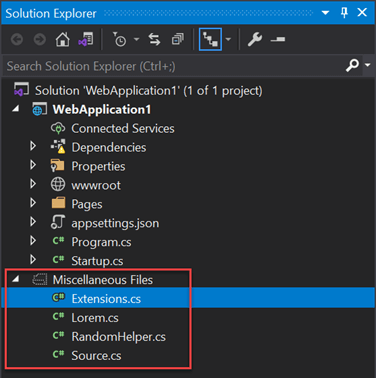
Optional: Show the source files into the Solution Explorer
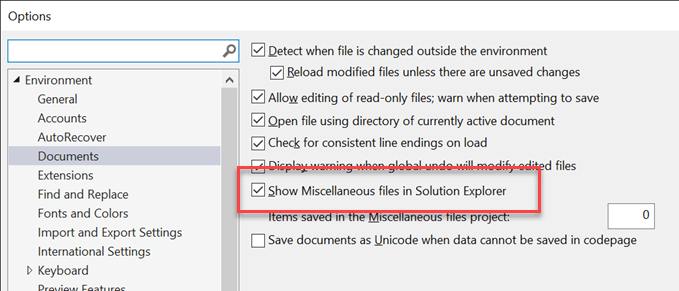
You may need to enable "Show miscellaneous files in Solution Explorer" in the VS settings.
#Additional resources
This post is part of the series 'Visual Studio Tips and Tricks'. Be sure to check out the rest of the blog posts of the series!
Do you have a question or a suggestion about this post? Contact me!