Here are some tips and tools to help you debug .NET applications. The goal is not to be exhaustive, but to give you useful ideas and starting points.
#Random tips
- Talk to a rubber duck
- Take a walk, sleep, play a game, etc. and come back to your code later with a fresh mind
- Read the documentation carefully
- Before changing the code, make sure you understand why it doesn't behave as expected
- Write an automated test that reproduces the bug, so you can quickly iterate on the fix
- Simplify the problem
- Delete or comment all the code that is not needed to reproduce the bug. In the end, you should have a small piece of code that reproduces the bug. (make sure the code is versioned so you can always revert to the original)
- Alternatively, create a new application and add code incrementally until you reproduce the bug.
- During the investigation, take time to add comments to the code when something isn't clear
- Time spent using a debugger rarely benefits the next issue, but improving logs and error messages does. This can save you and your coworkers time in the future.
Fixing issues is not the only part of the job. You also need to prevent them from happening in the first place. You can check this blog post to understand why fixing bugs is not enough.
#Is the code executed?
If you are unsure whether your code is actually executed, add a throw statement at the beginning. You can also write to the console in case the exception is caught and swallowed.
C#
public void MethodToDebug()
{
    Console.WriteLine("Debugging");
    throw new Exception("Debugging");
    // Your code here
}
#Starting the debugger from the code
A debugger gives you visibility into a system that is too complicated to understand by reading the code alone. It lets you step through code, inspect variables, set breakpoints, and understand what is happening in your application.
If you cannot start the process with a debugger and cannot attach to an existing process, you can use System.Diagnostics.Debugger.Launch() or System.Diagnostics.Debugger.Break(); where you want to set a breakpoint.
C#
public void MethodToDebug()
{
    Debugger.Launch();
    for (int i = 0; i < 100; i++)
    {
        if (i == 50)
        {
            Debugger.Break();
        }

        Console.WriteLine(i);
    }
}
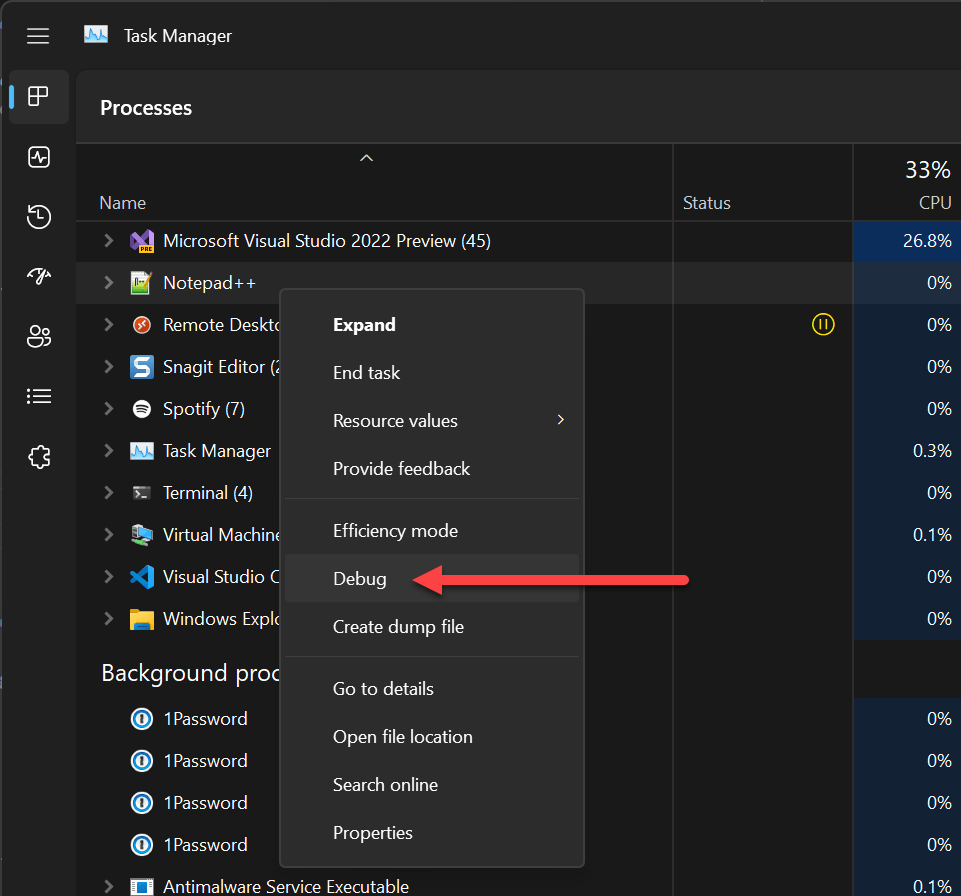
You can also use the Task Manager to start debugging a process:
#Debugging more than one process at a time
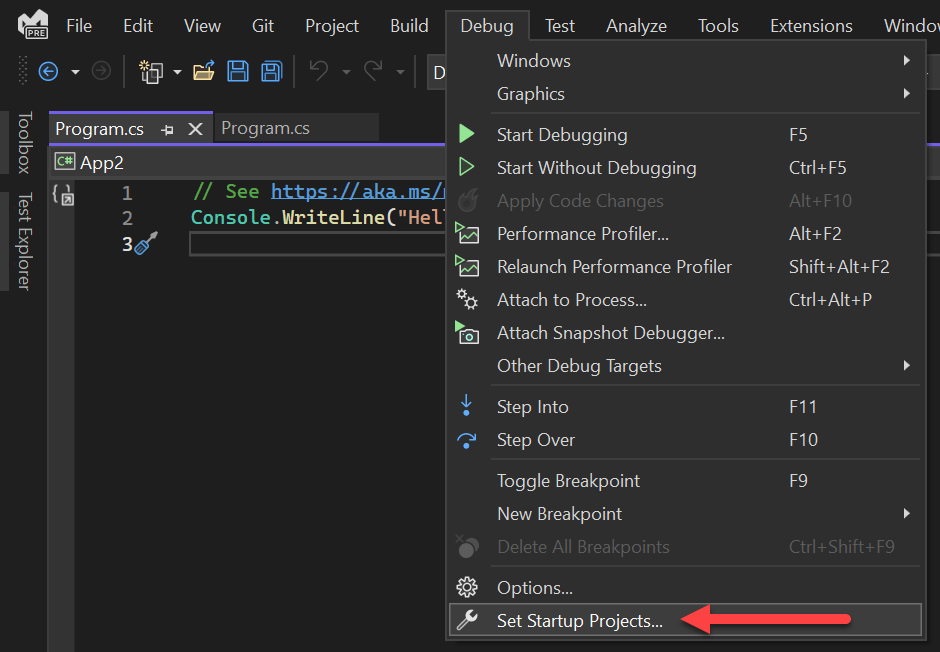
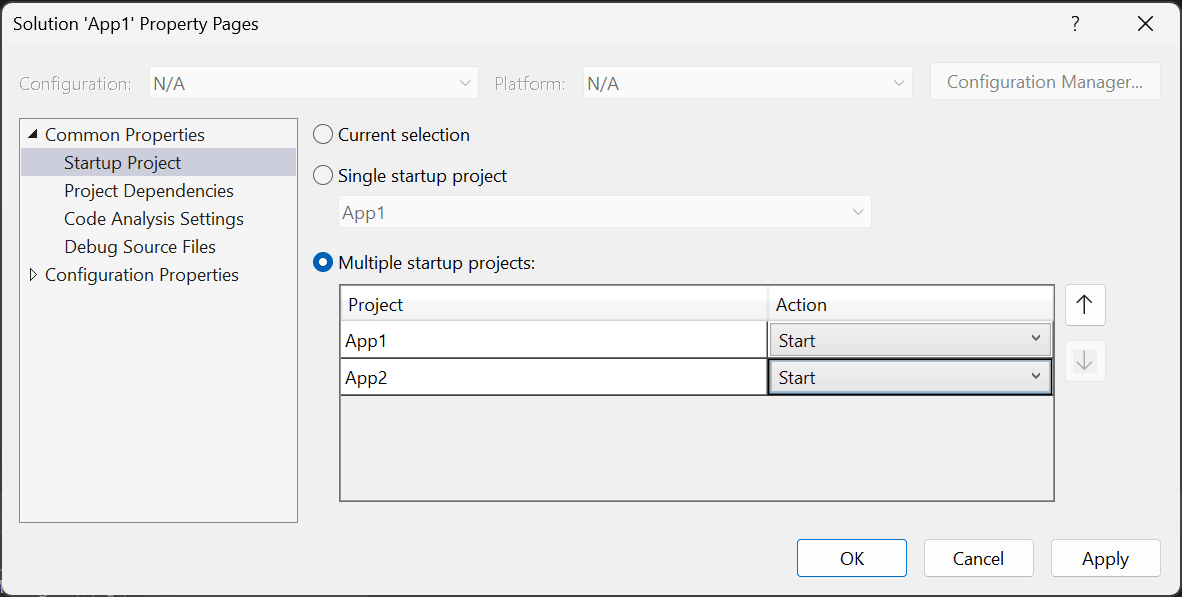
Visual Studio can debug multiple processes at the same time. For instance, you can debug a web application and a console application at the same time.
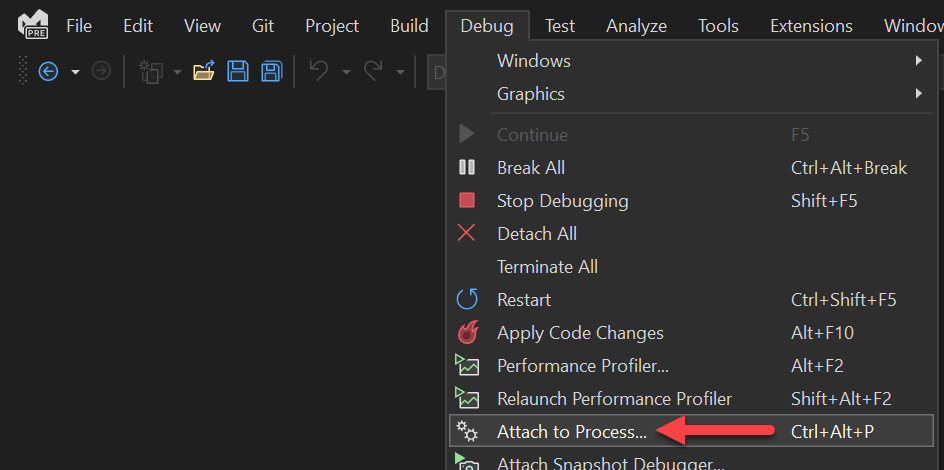
You can also attach to many running processes:
#Observing the value of a variable without a debugger
If you can't attach a debugger, you can log values using Console.WriteLine(), File.WriteAllText() or Logger.LogDebug() to output the values you want to observe.
C#
public void MethodToDebug()
{
    for (int i = 0; i < 100; i++)
    {
        if (i == 50)
        {
            // Temporary code
            File.WriteAllText("debug.txt", $"{DateTime.UtcNow}: i = {i}");
        }

        Console.WriteLine(i);
    }
}
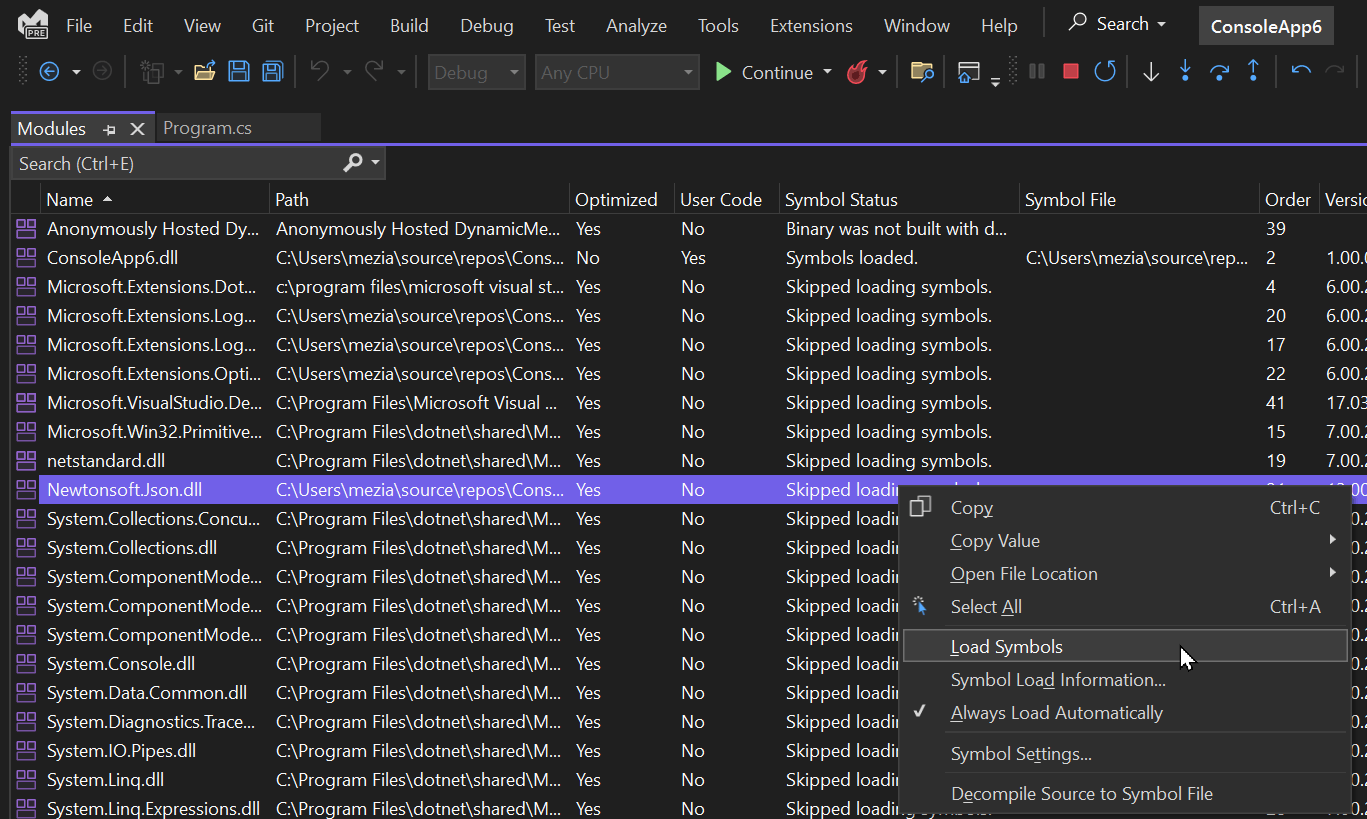
#Loading assembly symbols
Sometimes Visual Studio cannot find the symbols for an assembly. When this happens, you cannot use breakpoints. You can try to load the symbols manually by opening the Modules window (Debug > Windows > Modules), finding the module, and clicking Load Symbols:
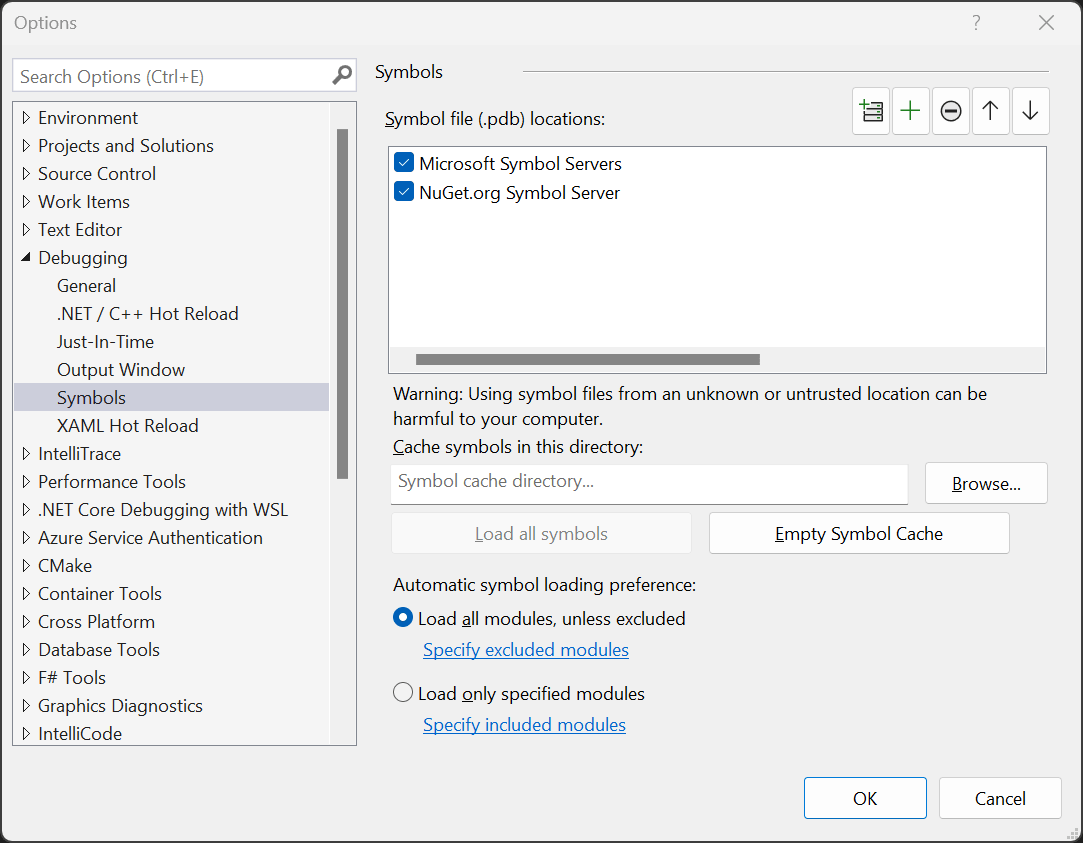
If it still cannot find the symbols, you may need to enable symbol servers in the options:
If you still can't find symbols for the module, you can disassemble it and debug using the disassembled code.
#Different kinds of Breakpoints
There are many ways to break into the code:
#Adding assertions
Breakpoints are useful for debugging, but they are not always convenient. You can use assertions to validate the state of your code.
C#
public void MethodToDebug()
{
    for (int i = 0; i < 100; i++)
    {
        Debug.Assert(i != 50, "i should not be 50");
        Console.WriteLine(i);
    }
}
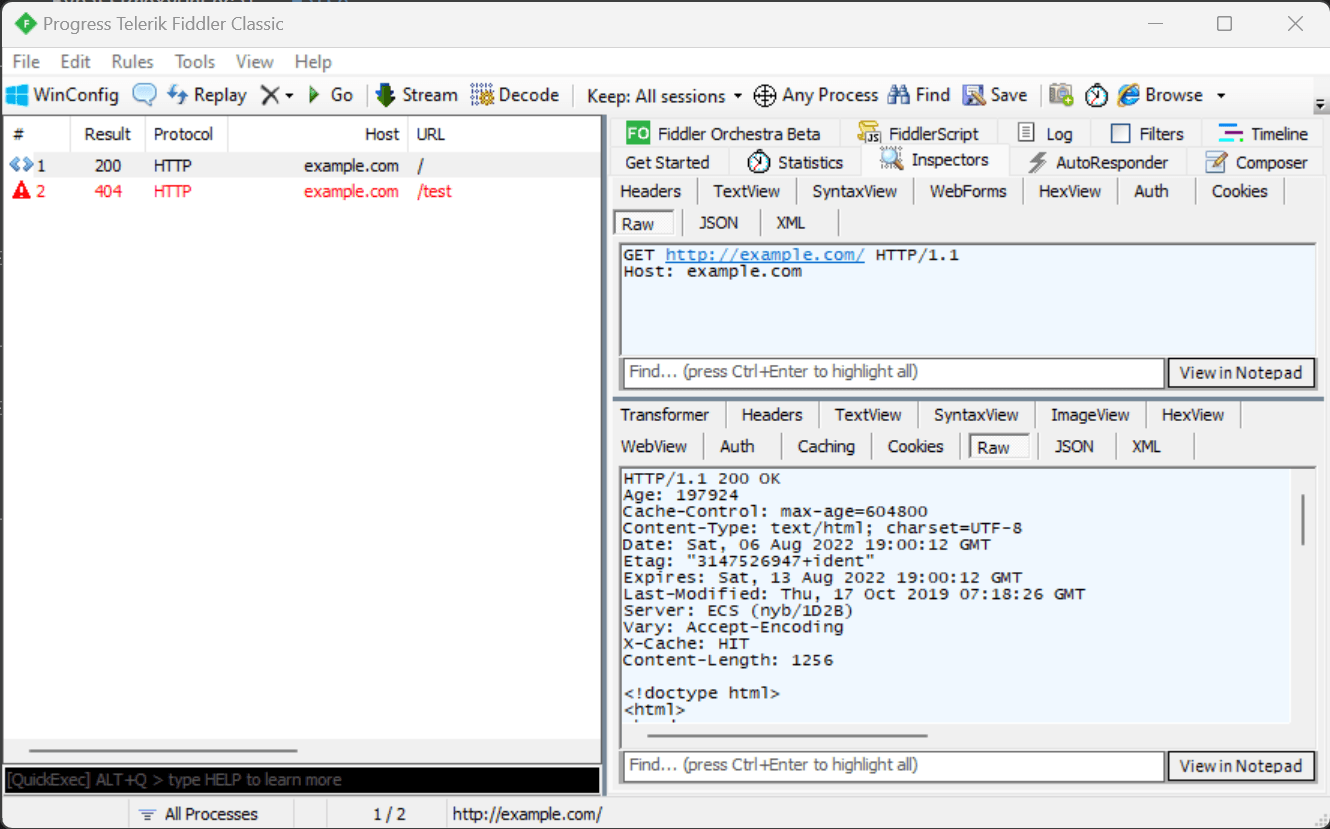
#Observing the application without a debugger
You can observe http calls using a proxy such as Fiddler
If you can see the requests and responses, you can manually configure the proxy in the code:
C#
using var handler = new HttpClientHandler();
handler.Proxy = new WebProxy("http://localhost", 8888)
{
    BypassProxyOnLocal = false,
    UseDefaultCredentials = true,
};
using var httpClient = new HttpClient(handler);
Chromium-based browsers: about://net-internals/, about://net-export/, Network tab in Developer Tools
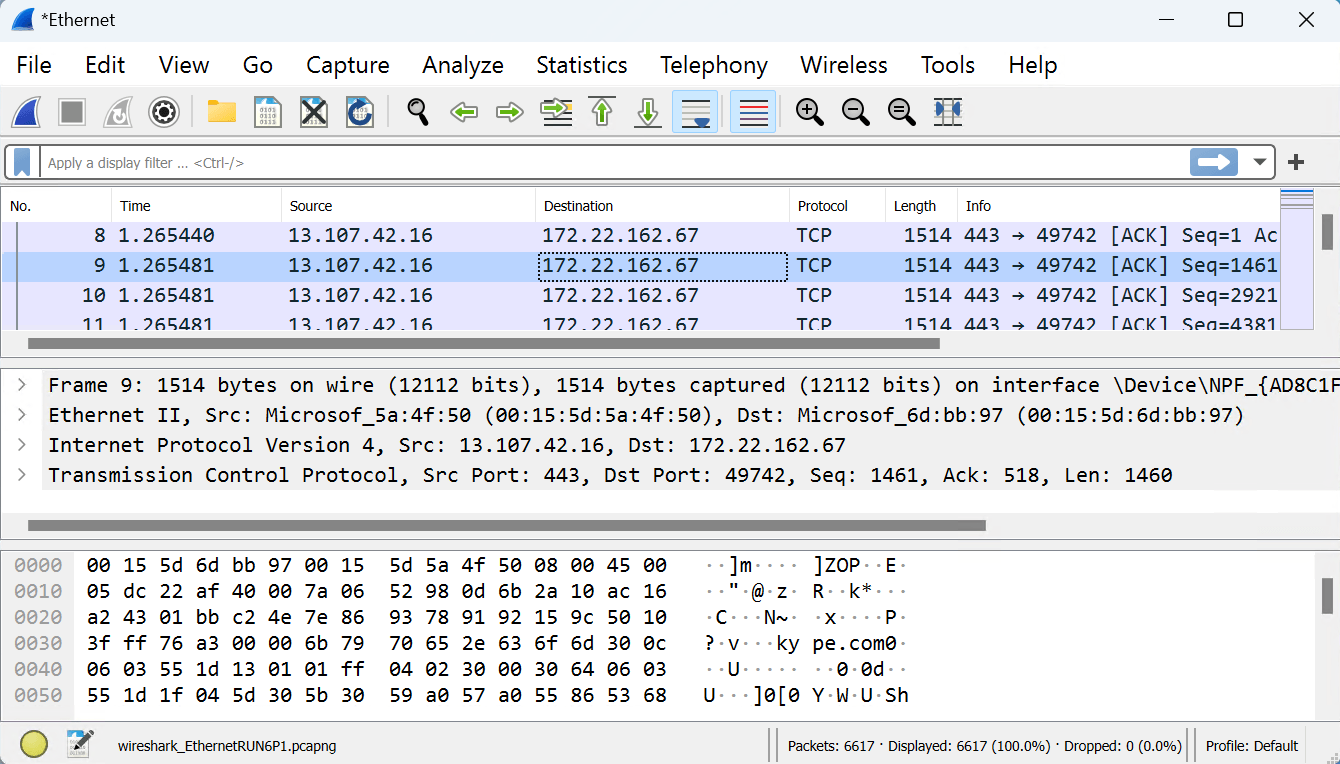
You can observe network traffic using WireShark
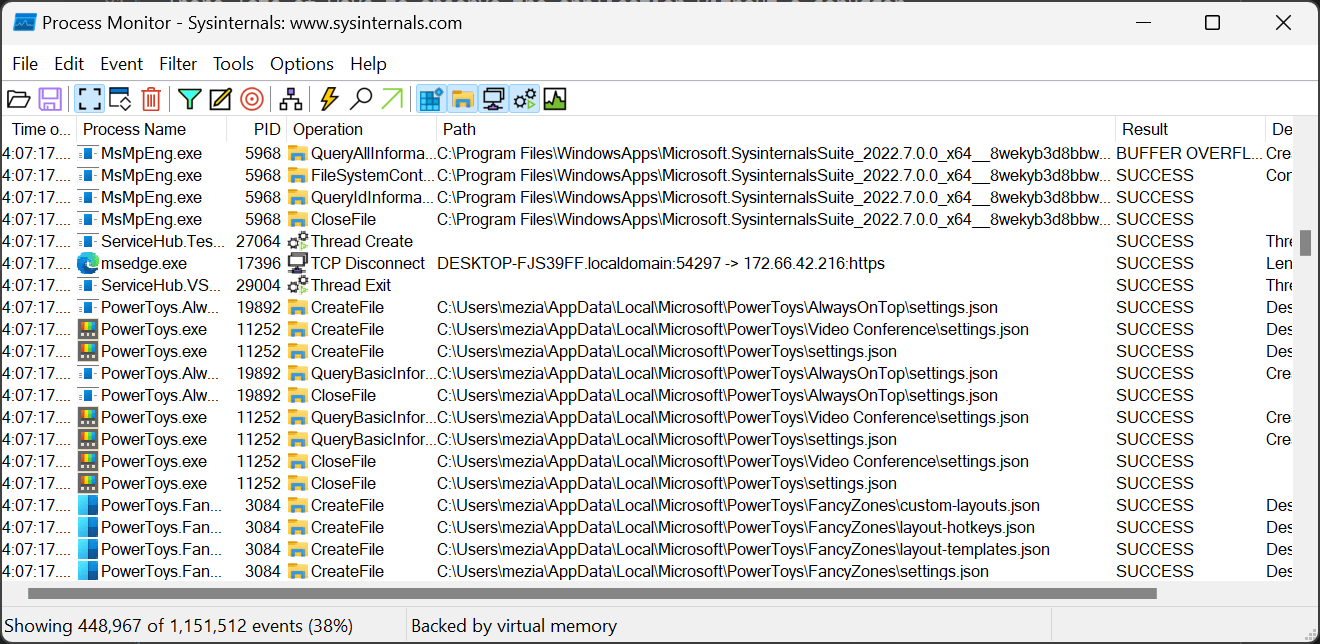
You can observe file system, registry and process/thread activity using procmon (Process Monitor) or wtrace
You can use dotnet-counter to quickly monitor things like the CPU usage or the rate of exceptions being thrown in your .NET Core application.
You can use dotnet-trace or PerfView to collect ETW events and stacks for your .NET Core application. In a .NET application, ETW events provide lots of information about an application, such as database queries, http calls, DNS queries, lock contention, thread pool info, Garbage Collector, JIT, Assembly loading, Activity, etc.
Windows Performance Analyzer creates graphs and data tables of Event Tracing for Windows (ETW) events.
You can take a dump of the application using dotnet-dump and analyze it later using Visual Studio. If you need to create a dump when certain conditions are met, you can check ProcDump. There are various other ways to create a dump file; see my previous post about How to generate a dump file of a .NET application for more information.
You can create a crash dump file when an application crashes by setting a registry key or an environment variable
You can list handles (opened files, registry keys, ports, synchronization primitives) using Handle or ProcessExplorer
You can see memory allocations using Visual Studio
Visual Studio provides many tools to debug an application. If you need more advanced tools, you can use WinDbg and dotnet-sos. Sysinternals tools are also very useful.
#Viewing values in the debugger
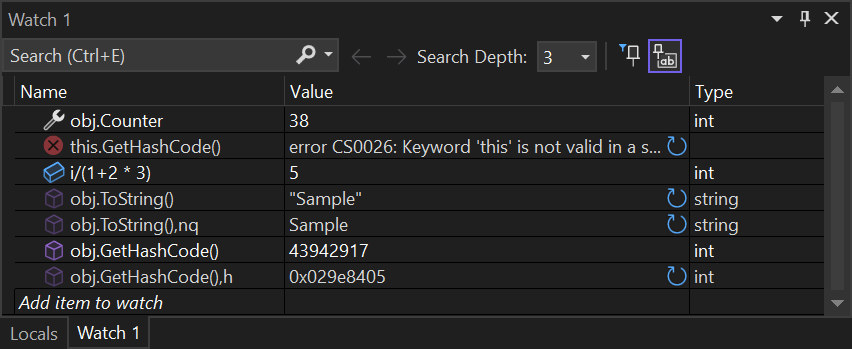
Watch windows (Debug > Windows > Watch > Watch 1) allow you to evaluate multiple expressions. All expressions are recomputed when execution is suspended. Note that you can use commands such as nq (no quote) or nse (no side-effect), h (hexa).
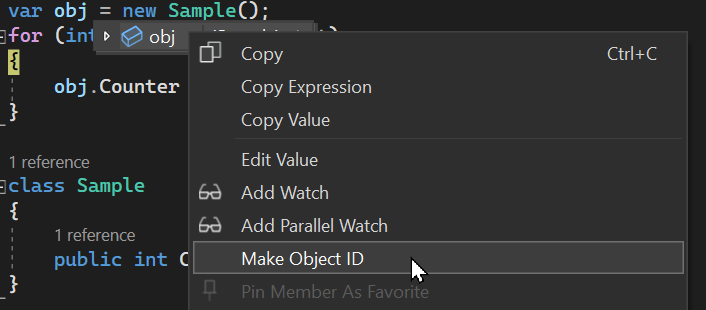
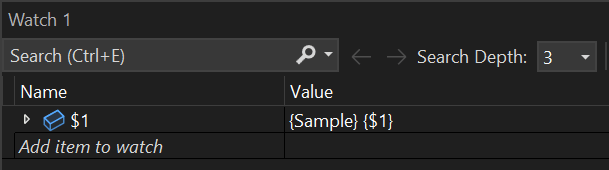
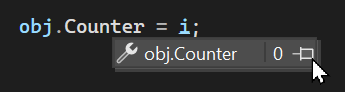
Object ID allows to create a globally accessible id for an object. So, even if the value is not accessible in the current context, you can still reference the value using $N where N is the object ID.
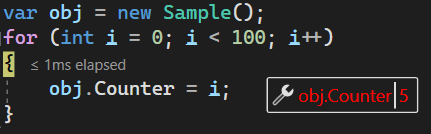
Data tips provide a convenient way to view information about variables in your program during debugging. Values are highlighted in red when they change since the last evaluation, making it easy to spot what changed.
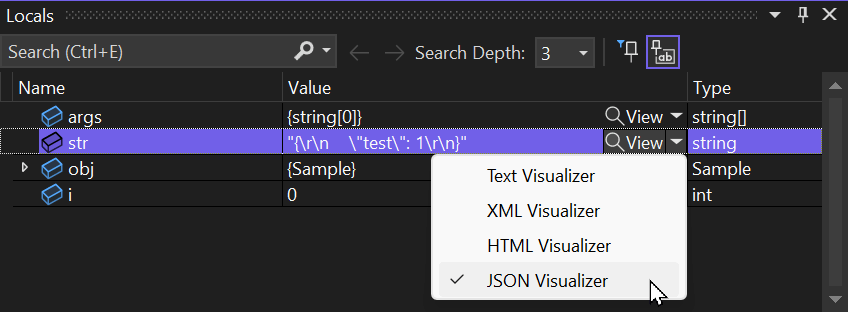
Custom visualizers allow you to show formatted values instead of raw values. There are visualizers for string (documentation) or IEnumerable (documentation) values.
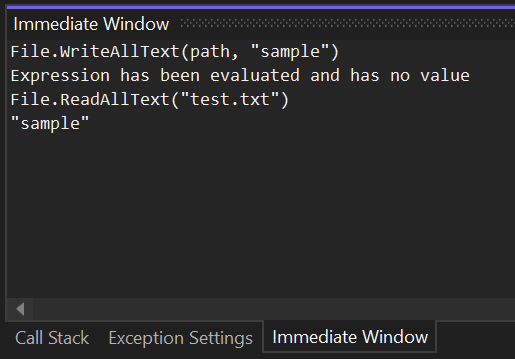
The Immediate Window allows you to execute arbitrary code and see the result.
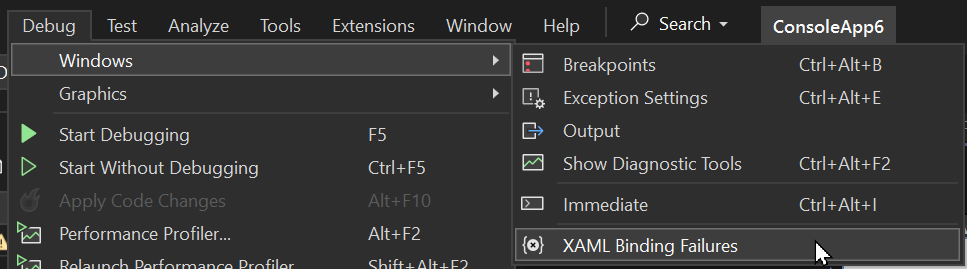
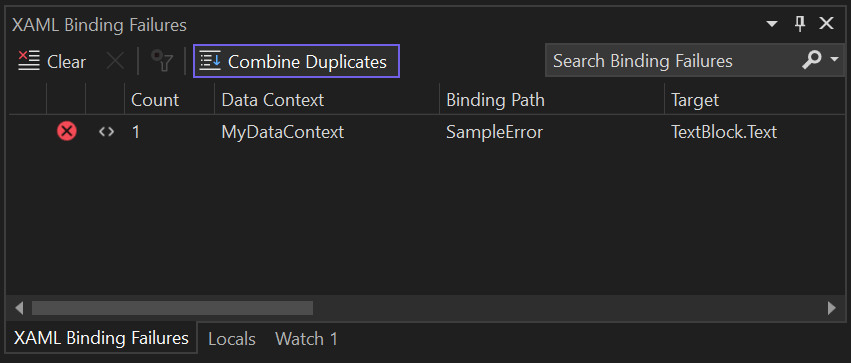
#XAML Binding Errors
You can view XAML binding errors in Visual Studio. When running the application, all binding errors are shown in this window.
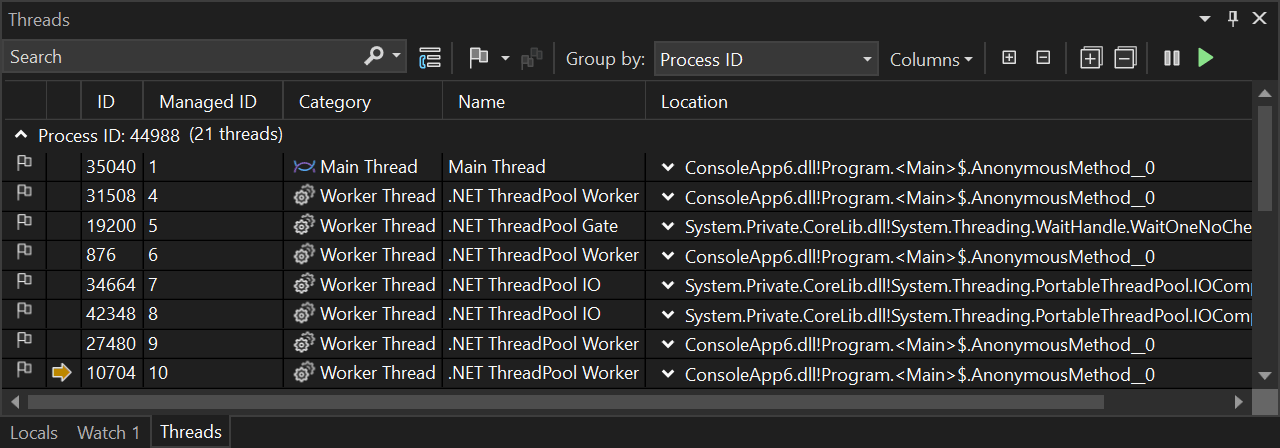
#Debugging multi-threaded applications
View running threads (Debug > Windows > Threads). Double-click a thread to switch to it.
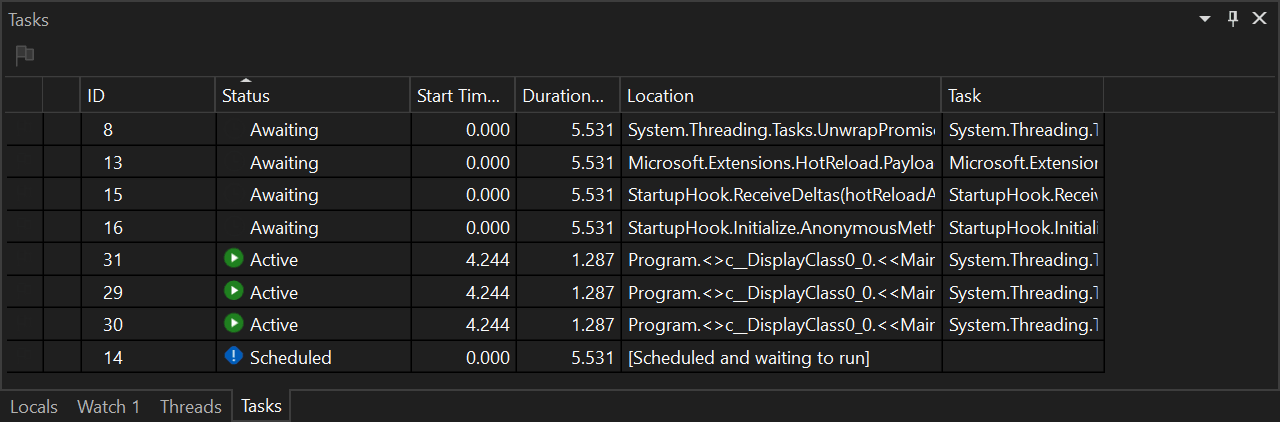
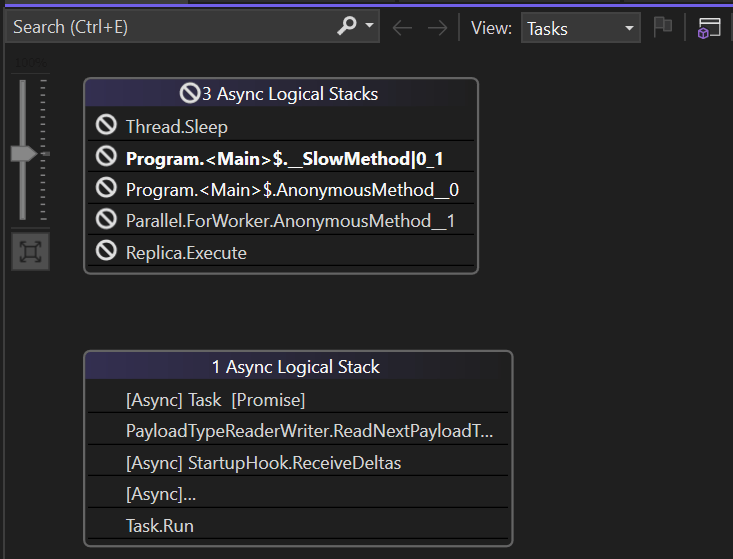
View .NET Tasks (Debug > Windows > Tasks)
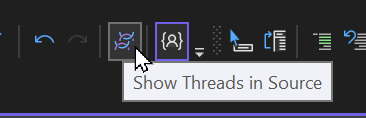
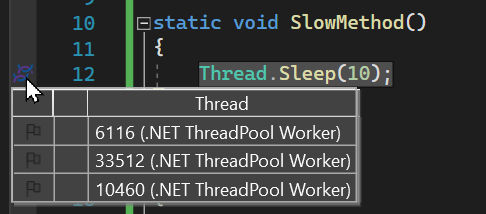
Show threads in source
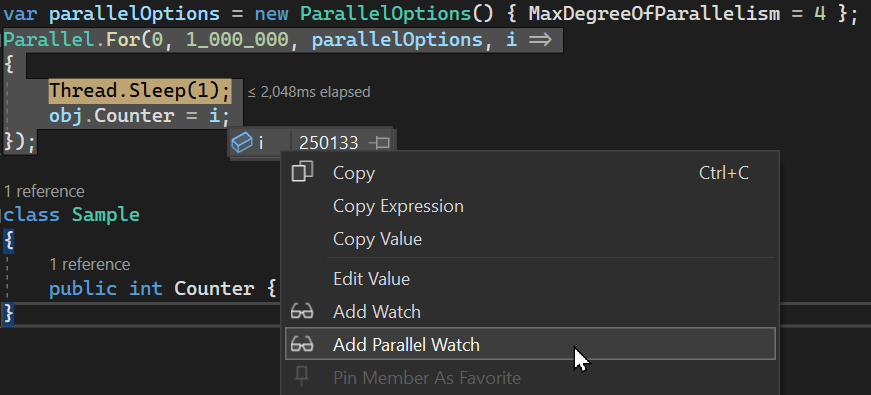
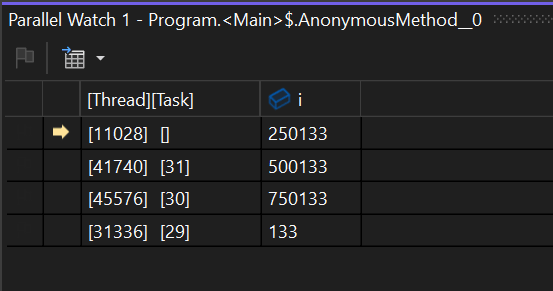
Parallel Watch allows you to evaluate an expression for all threads
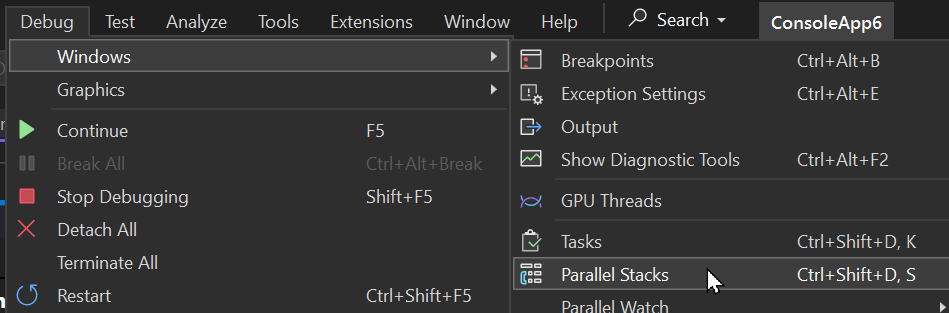
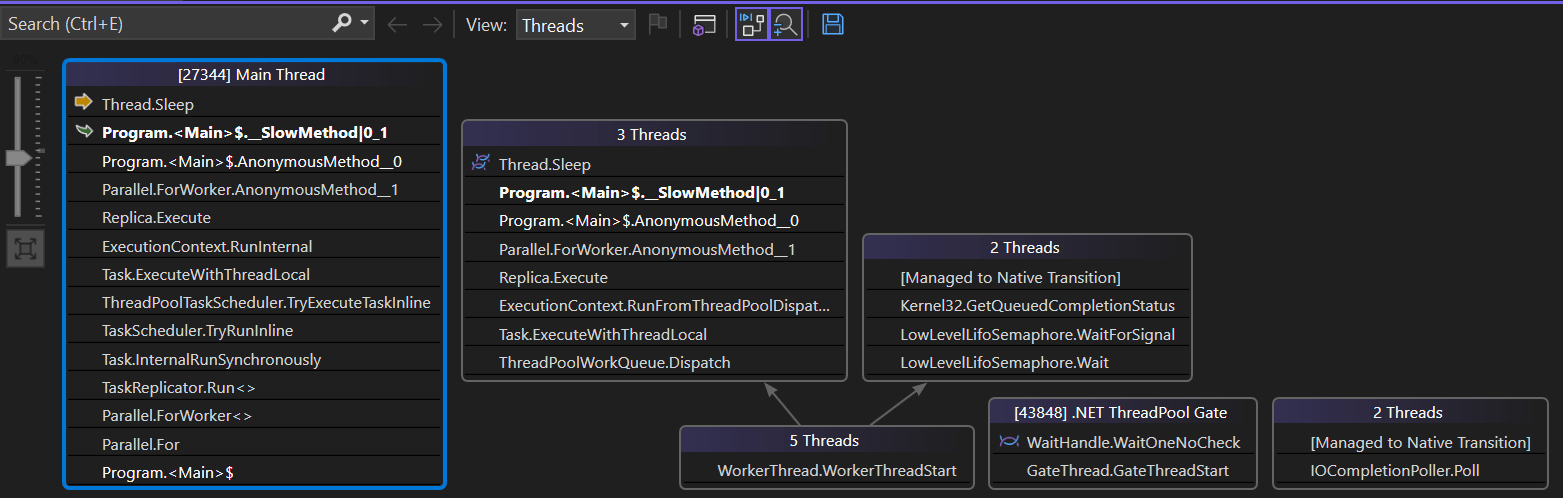
View threads and tasks in the Parallel Stacks window (documentation and blog post). This window is particularly useful: it combines similar stacks and tasks, shows the number of threads and tasks running the same code, and gives you a clear picture of what is happening in your application.
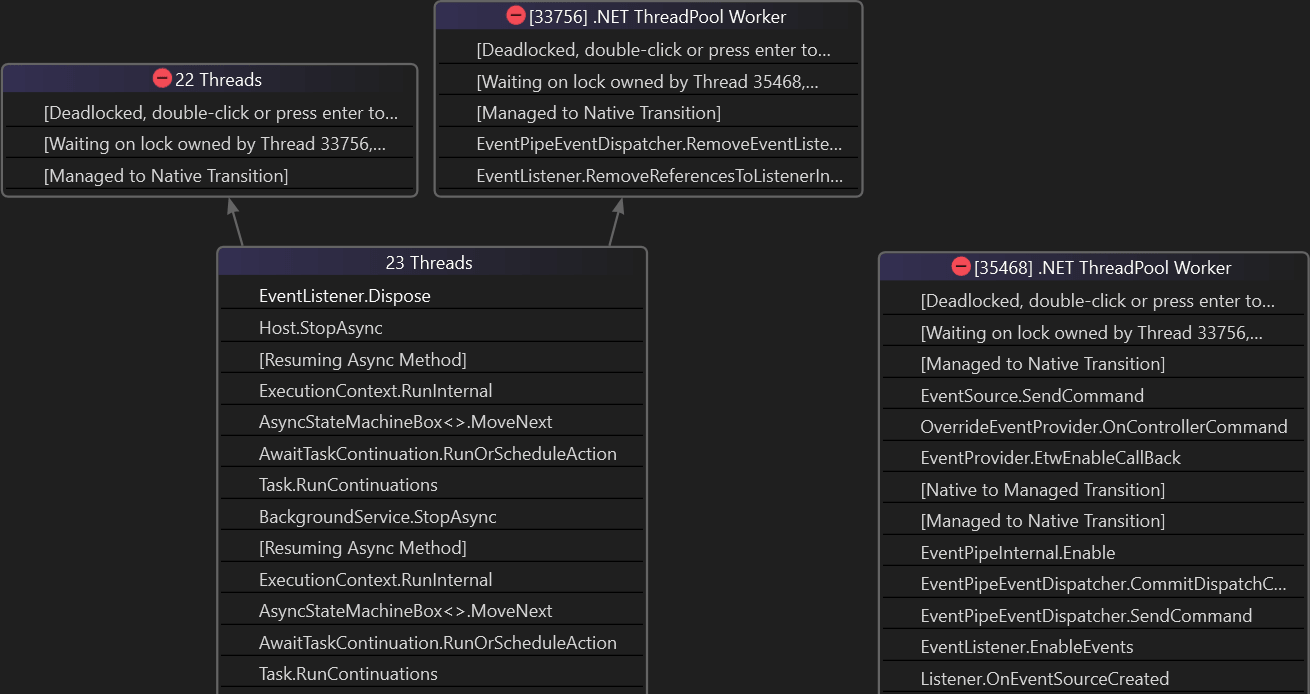
Detect deadlocks using the parallel stacks window:
##Check used ports on Windows
PowerShell
$Port = 5000
Get-Process -Id (Get-NetTCPConnection -LocalPort $port).OwningProcess
Get-Process -Id (Get-NetUDPEndpoint -LocalPort $port).OwningProcess

netstat -a -b
##Check DNS configuration
PowerShell
Resolve-DnsName -Name www.meziantou.net
Resolve-DnsName -Type A -Name meziantou.net
You can also use an online service, such as https://dnslookup.online/, to check the DNS configuration.
Do you have a question or a suggestion about this post? Contact me!