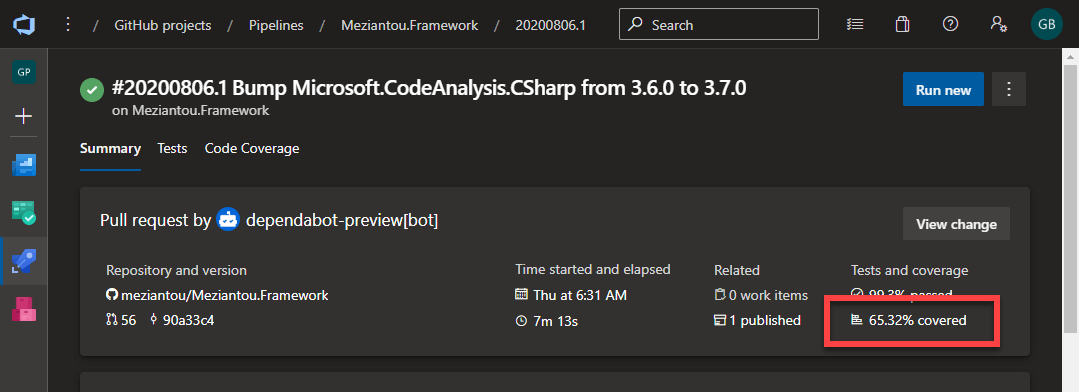
In a previous post, I explained how to compute code coverage for a .NET Core project with Azure DevOps and Coverlet. While code coverage results can be viewed directly in Azure DevOps, as a developer you may want to see them in your IDE instead.
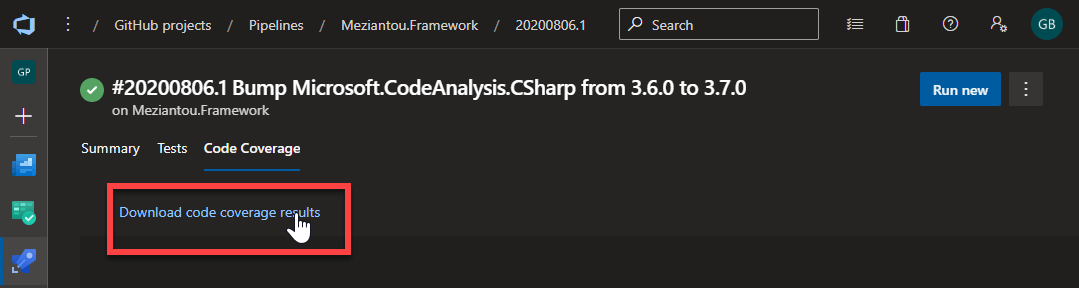
Download the code coverage file from the build artifacts
Open the file in Visual Studio
In the "Code Coverage Results" tool window, find the method you want and double-click on it to open the file in the editor with the coverage highlight
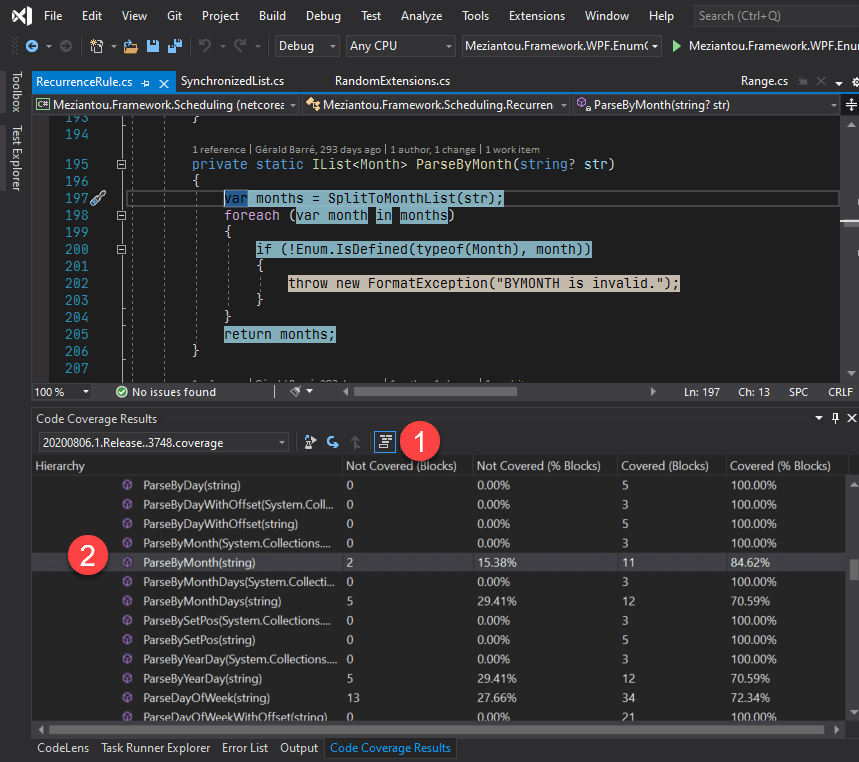
Be sure to click on the "Show Code Coverage Coloring" button in the tool window. Visual Studio highlights the lines with 3 different colors:
- Green: block is covered
- Orange: block is partially covered
- Red: block is not covered
You can now quickly identify which areas need more test coverage!
This post is part of the series 'Visual Studio Tips and Tricks'. Be sure to check out the rest of the blog posts of the series!
Do you have a question or a suggestion about this post? Contact me!