This post is part of the series 'Microsoft SQL Server 2016'. Be sure to check out the rest of the blog posts of the series!
SQL Server 2016 has been released, and it's time to explore its new features. Today, we look at Live Query Statistics.
SQL Server 2014 introduced the DMV sys.dm_exec_query_profiles (doc) to retrieve information about the progress of a running query. Live Query Statistics builds on this DMV by adding a graphical interface, letting you view a query's execution plan while it runs. The plan shows the progress of each operation along with statistics such as the number of rows produced, elapsed time, and more. Because this data is available in real time, it is much easier to understand why certain queries are slow.
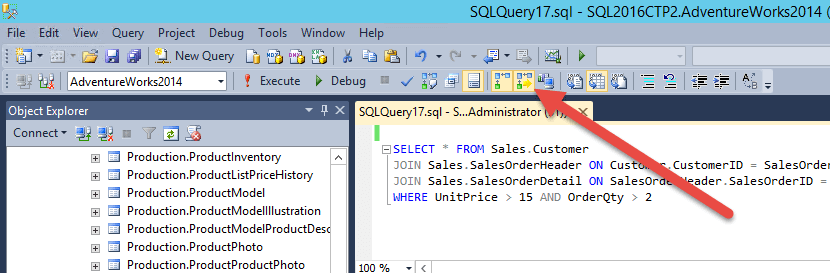
To enable this feature, click the "Include Live Query Statistics" button:
When you run the query, you can see the overall execution plan and the progress of each operation:
- Dashed lines: operations waiting for execution
- Animated dashed lines: ongoing operations
- Full lines: completed operations
Note that Live Query Statistics does not support all queries. Queries using Columnstore indexes, Memory-Optimized Tables, or natively compiled stored procedures are not supported. This may change in future updates. Also, enabling this feature may slightly reduce query performance.
Now all you need is a complex enough query to have time to enjoy the animation!
Do you have a question or a suggestion about this post? Contact me!